Sunset Time Graphs
/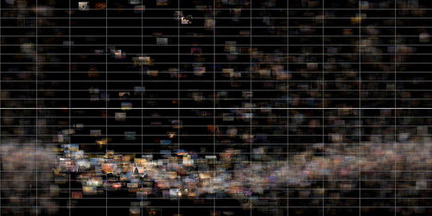
Jim Bumgardner (a.k.a. jbum) has put together some pretty intriguing time graphs using photos from Flicker. Over one year he collected 15000 photos posted to Flickr with the tag Sunset. He then used the image's EXIF data to tell when the photo was taken and graph the photos accordingly. The horizontal axis represents the days of the year and the vertical access shows the time of day. The photos are dimmed to reflect the number of images posted at that time. The overall effect is a graph that shows the sun's cycle over the seasons. He also calls attention to the echo of sunset photographs taken between 5-7am caused by all the people who have their cameras am and pm settings backwards.
Check out this and more fascinating graphs by Jim on his flickr account.